Underground Steam Distribution

Steam Leak Detection for Underground Distribution

Aircraft-based infrared surveys that locate failing steam lines, manhole losses, and conduit leaks across campuses, military bases, and municipal networks in a single mission.

37+ Years

Of Infrared Expertise

50 States

Plus Alaska & Puerto Rico

Aircraft

Not Drones

Engineered

For Facility Decision-Makers

What Is Aerial Steam Leak Detection?

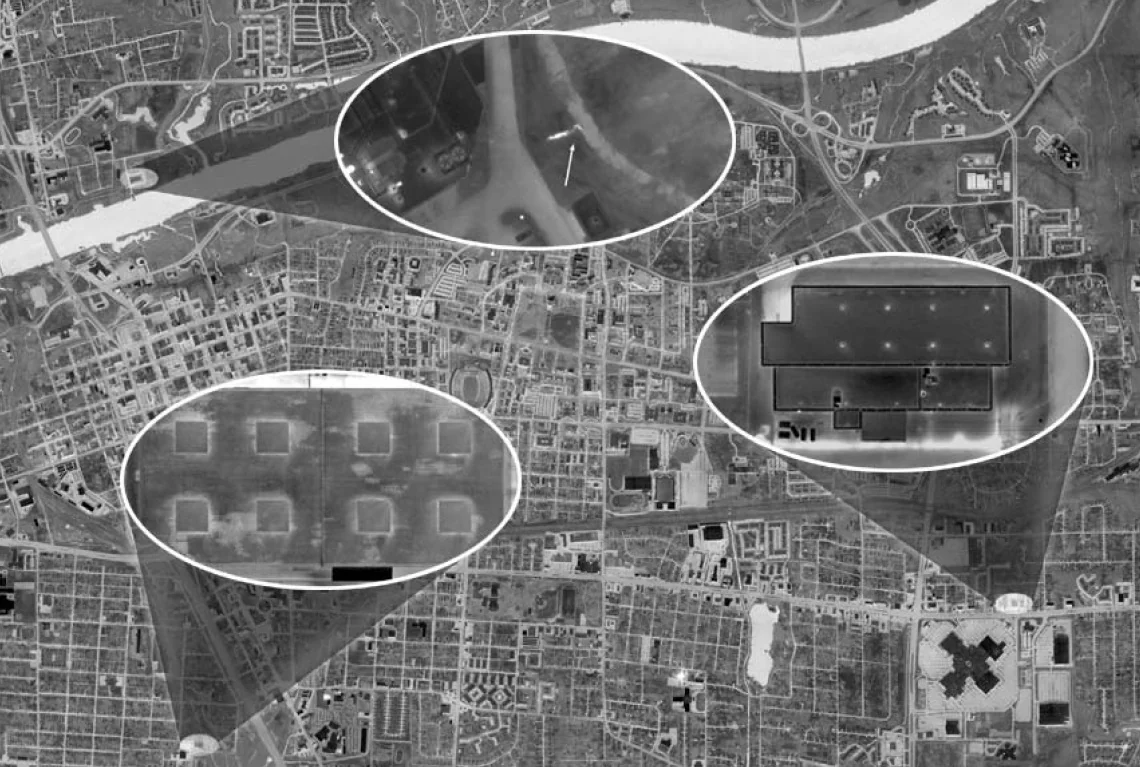
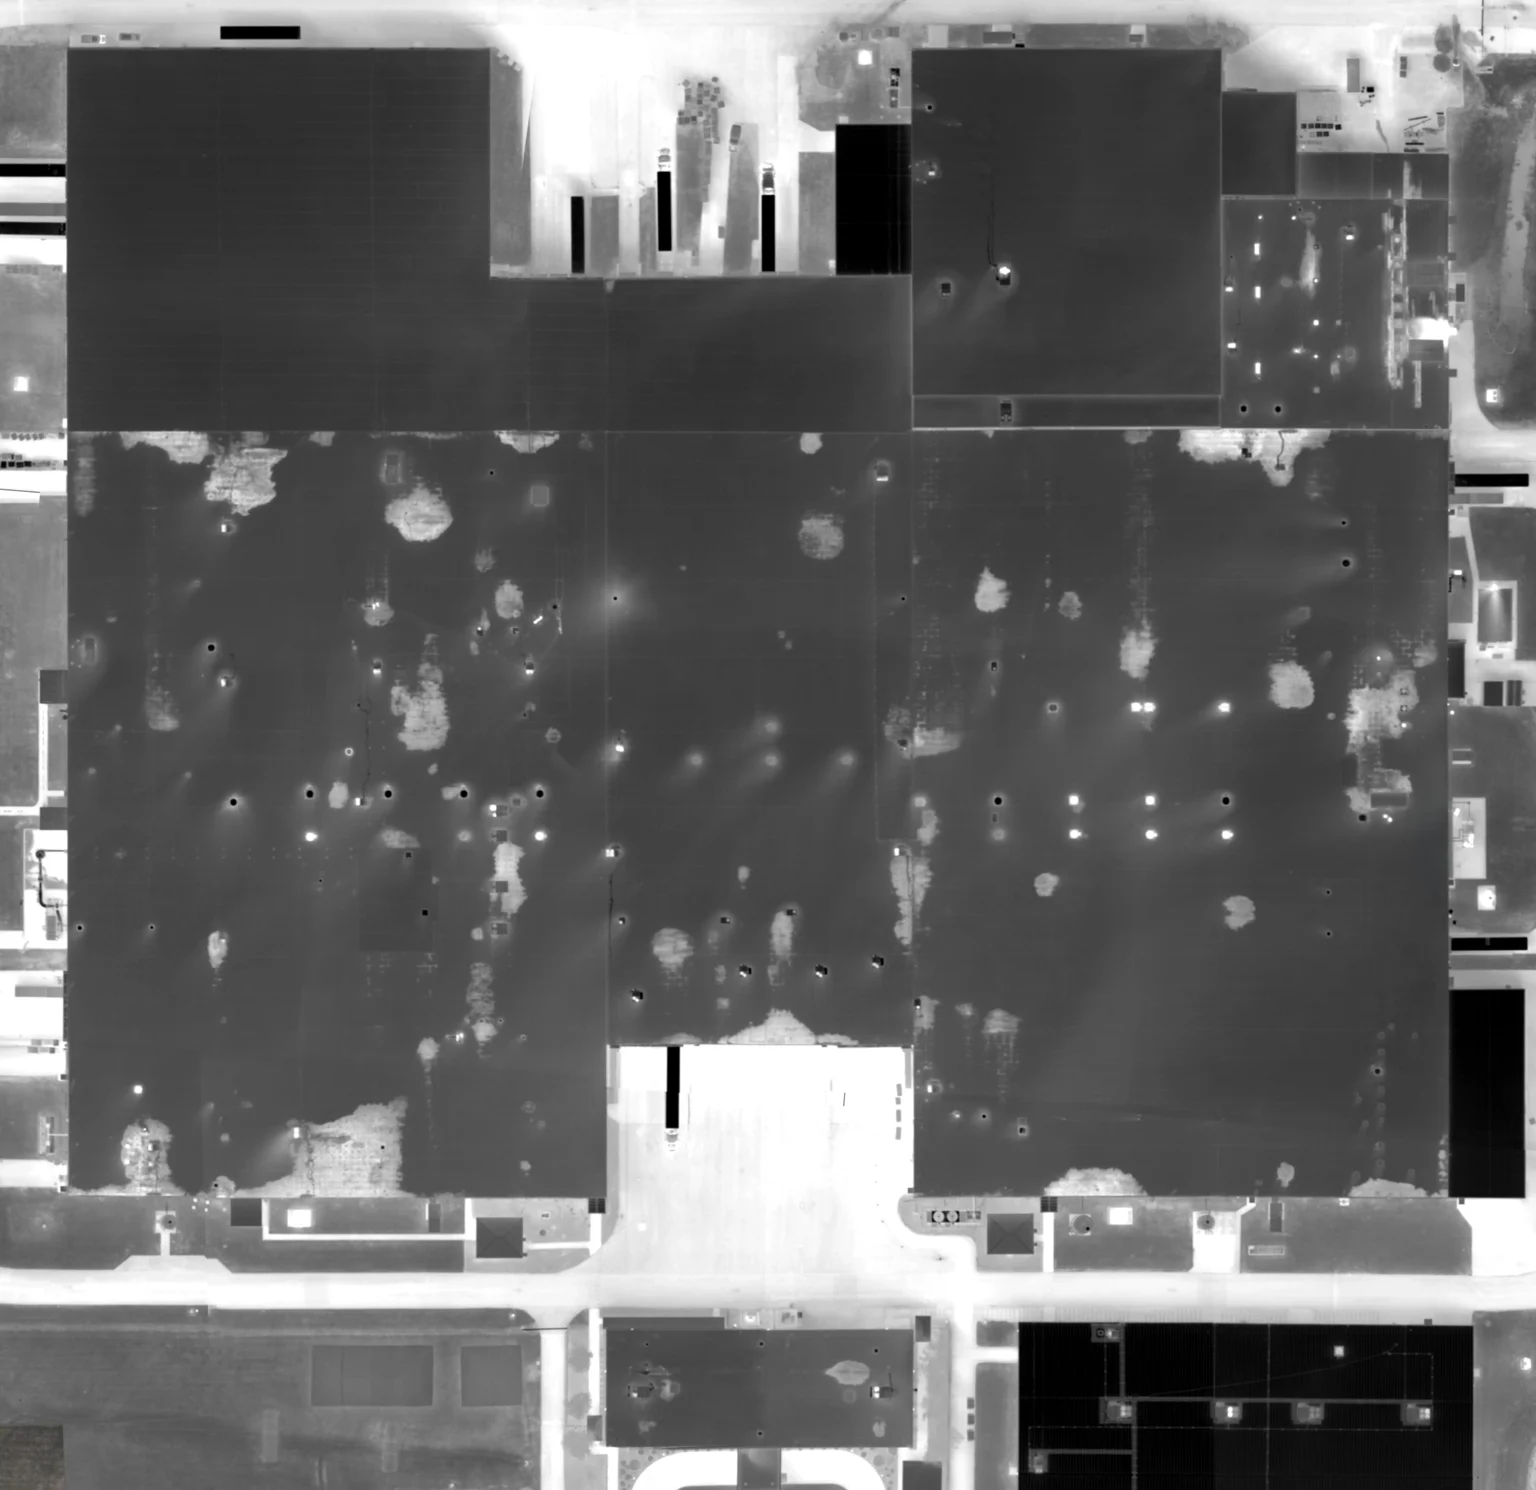
Aerial steam leak detection is a non-destructive inspection method that uses aircraft-mounted thermal imaging to identify failing steam lines, manhole losses, and conduit leaks across the entire underground distribution footprint. Where the soil above a leaking line is warmer than the surrounding ground, our sensors capture that signature and georeference every anomaly to its exact location.

The result is a ranked map of every active loss across your distribution system, tied to your existing as-built drawings. Instead of chasing complaints or excavating speculatively, your maintenance and engineering teams know exactly which segments need repair, which need replacement, and which are operating as designed.

We’ve been doing this work for decades using aircraft engineered specifically for thermal collection — not consumer hardware, not adapted equipment. The data is built to support engineering specifications, capital requests, and rate-base or regulatory reporting.

What an Aerial Steam Survey Delivers

Full-Network Loss Mapping
Every active steam loss across the system — main lines, laterals, manhole vaults, building entries — captured in a single window and georeferenced to the exact location of the anomaly.
Severity-Ranked Findings
Each anomaly is graded by thermal intensity so your maintenance and engineering teams can triage repairs against budget cycles and operational impact rather than reacting to the loudest failure.
Engineering-Grade Deliverables
A formatted report tied to your distribution drawings — defensible for scoping repairs, supporting capital requests, and documenting the loss profile to ratepayers, regulators, or command stakeholders.

Built for the Operators of the Largest Steam Networks

Universities & Colleges
District energy plants serving dozens of buildings across miles of underground distribution. A single survey replaces months of ground walking.
Military Installations
Bases with extensive central-plant steam networks supporting barracks, hospitals, and operational facilities. Complete loss inventory in a single mission.
Hospital & Medical Campuses
Critical-environment networks where steam supports sterilization, heating, and humidity control. We work without entering occupied spaces or shutting down service.
Municipal District Energy
City-owned and investor-owned networks delivering steam to downtown districts. Full-system coverage in one overnight mission — no lane closures, no street access.

Why Aircraft-Based Infrared Is the Right Tool for Distribution Networks

For a single manhole or a short segment, ground-based thermography and short-range platforms have their place. For miles of underground distribution, the math changes fast — coverage area, atmospheric consistency, and survey conditions all favor aircraft.

A single aircraft mission can scan the full distribution footprint of a major university, military installation, or city steam loop in one overnight flight. Our thermal sensors operate in the spectral bands engineered for ground-surface temperature differentials at altitude — not the consumer-grade wavelengths typical of short-range UAS payloads. We fly when the diurnal heat load has decayed and contrast is sharpest.

The result isn’t just faster — it’s more consistent. Every segment is scanned in the same flight, under the same conditions, with the same sensor. That consistency is what makes the dataset defensible for engineering and capital planning decisions.

How a Steam Survey Engagement Works

01
Initial Conversation
A short call to understand the network — service area, miles of distribution, plant capacity, known problem areas, and the decision-makers on your side.
02
Net Meeting
A working session with your facilities, engineering, and energy team where we walk through the methodology, deliverables, and how the survey integrates with your distribution drawings.
03
Scheduled Flight
We schedule the mission for the optimal thermal window — typically overnight, with clear sky and minimal wind. Flight plans and coordination notes are delivered well in advance.
04
Engineering Report
A defensible thermal report ranking every loss by severity, tied to your distribution drawings, with recommended actions and imagery your maintenance team can scope from directly.

The Cost of Letting a Distribution System Leak

Steam is one of the most expensive utilities a facility produces. Every pound lost to the ground is fuel burned for nothing — and for large distribution operators, those losses scale into the millions of dollars per year. The Department of Energy has consistently documented distribution losses of fifteen to twenty-five percent on aging networks, much of it concentrated in a handful of recoverable failures.

An aerial infrared survey changes the economics. Instead of chasing complaints or excavating speculatively, your team works from a ranked map of every active loss across the network. For most clients, the cost of the survey is recovered in fuel savings within a single heating season — and the repaired system delivers compounding savings for years afterward. The data also strengthens the capital case: when a segment is recommended for replacement, the thermal evidence supports the budget request in a way that anecdotal complaints cannot.

There is a second economic dimension that matters on aging networks: avoided consequential damage. A steam line failure under a city street or a campus quad rarely fails quietly. The repair cost is one line item; the lane closures, service interruptions, paved-surface restoration, and reputational exposure are the rest of the bill. Catching the precursor signature months earlier converts an emergency into a scheduled scope of work — and converts the political and operational risk into something the engineering team controls rather than responds to. The ROI math on a steam survey rarely needs to be argued; the harder argument is usually about which segments to address first, and the thermal data answers that question directly.

Decades of distribution work across universities, military installations, and municipal energy operators have produced a consistent pattern: the operators who survey on a defensible cadence run a measurably more efficient system than operators who don’t, and the gap widens as the network ages. The survey isn’t a cost line — it’s an investment in the operating efficiency, the capital posture, and the regulatory standing of the system.

Frequently Asked Questions

Aircraft-mounted thermal sensors capture the temperature signature of the ground surface above your buried steam network. Where a line is losing heat, the soil above it runs measurably warmer than the surrounding ground. We fly the entire network under controlled thermal conditions — typically overnight — and georeference every anomaly to its exact location on the distribution map. The result is a complete loss inventory across the network rather than a series of partial inspections. Every operational decision the network supports — fuel procurement, maintenance dispatch, capital prioritization, rate-base reporting — becomes incrementally more defensible when it's grounded in a current thermal dataset rather than in an aging set of assumptions about where the losses are.
The argument is physics and coverage area. Aircraft fly at the altitude needed to capture a multi-mile distribution network in a single mission, under consistent thermal and atmospheric conditions. Short-range platforms are well suited to a single manhole or a short segment, but as the network grows the consistency of the dataset erodes — different battery cycles, different weather windows, different sensor calibration. For distribution-scale inspection, aircraft deliver one dataset of one network, captured once, under the same conditions.
When the survey is flown under proper thermal conditions and analyzed by experienced thermographers, aerial infrared reliably identifies active steam losses across the network. Findings are ranked by thermal intensity, and ground-truth verification at representative locations confirms the severity of the loss before excavation. Decades of operational history support the methodology, and the analyst workflow has been refined through thousands of distribution surveys.
A typical university campus or military installation is scanned in a single overnight flight. City-scale distribution networks are typically completed in one or two flight windows depending on the size of the service area and regional weather. Initial ranked findings are usually delivered within two to four weeks of the survey, with the full engineering report following shortly after.
Universities, military installations, hospital campuses, and municipal district energy operators see the largest return because the distribution footprint is large enough that walking the system on foot or by drone is operationally impractical. Smaller plants with a few hundred feet of distribution are better served by ground-based methods. The rule of thumb: if the network exceeds what a single technician can walk in a shift, aerial is the right tool.
Each report includes a network-wide site map, thermal imagery for every anomaly, severity ranking, recommended next actions, and supporting documentation suitable for scoping repairs, justifying budget requests, and updating distribution drawings. The format is designed to integrate with your existing engineering and maintenance workflow rather than create a parallel paper trail.

Ready to Map Your Distribution Losses?

Tell us about your network. We’ll set up a working session with the right people on your team and walk through how an aerial steam survey would apply to your specific distribution footprint.