Municipal Thermal Mapping

CityScan IR: City-Scale Aerial Thermography

Municipal-scale thermal mapping that surveys an entire city’s steam, hot water, and underground utility distribution networks in a single flight window.

37+ Years

Of Infrared Expertise

50 States

Plus Alaska & Puerto Rico

Aircraft

Not Drones

Engineered

For Facility Decision-Makers

What Is CityScan IR?

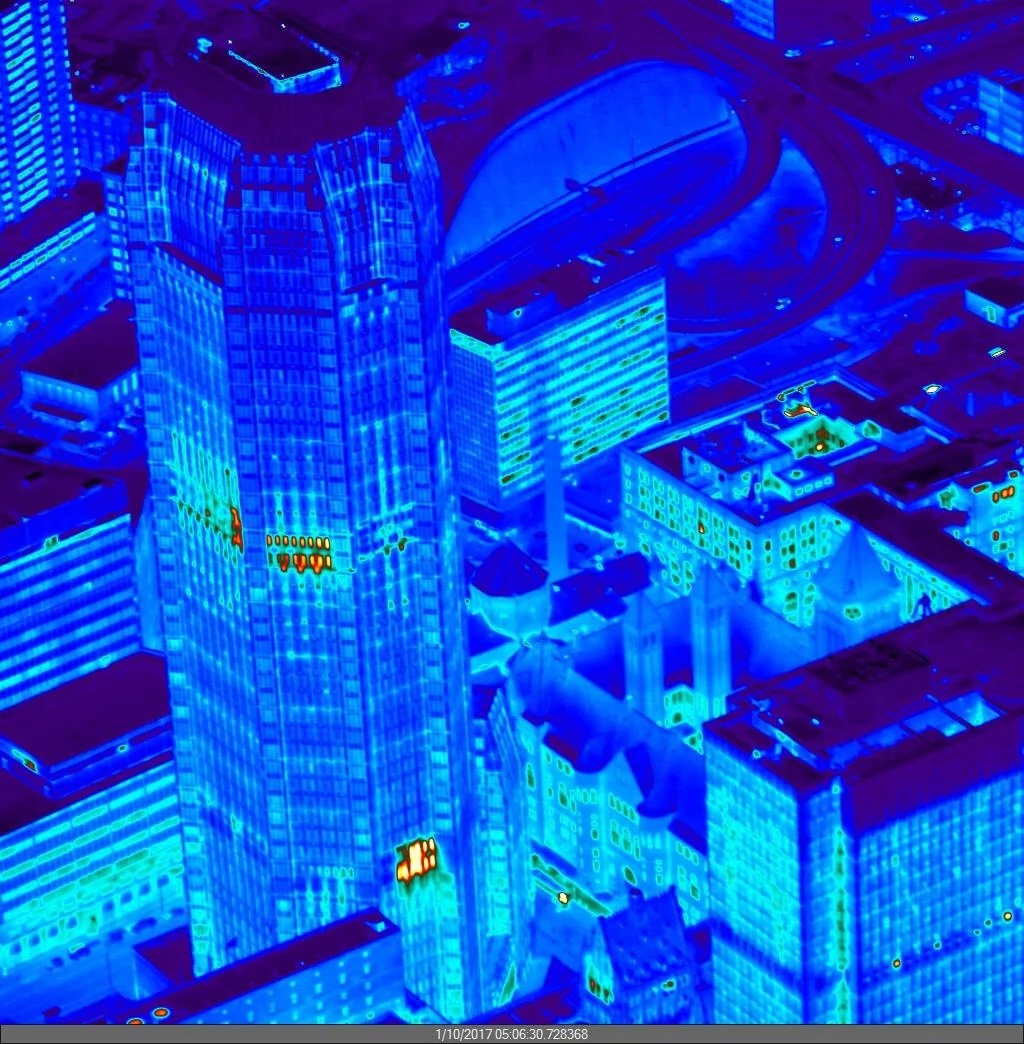
CityScan IR is a non-destructive inspection program that uses aircraft-mounted thermal imaging to map an entire city’s underground steam, hot water, and chilled-water distribution networks in a single overnight mission. Where heat is escaping from a buried line, our sensors capture that signature and georeference every anomaly across the full service area to your utility GIS.

The result is a citywide loss inventory tied to your distribution drawings, ranked by severity. Instead of inspecting the network street by street, your operations and engineering teams know which segments need attention, which need replacement, and where the system is operating as designed.

We’ve been doing this work for decades using aircraft engineered specifically for thermal collection — not consumer hardware, not adapted equipment. The data is built to support city engineering workflows, rate-base reporting, and capital planning across multiple agencies.

What CityScan IR Delivers

Citywide Distribution Mapping
Every active thermal loss across the underground network — steam, hot water, chilled water — captured across the full service area in a single mission and tied to your utility GIS.
Severity-Ranked Loss Inventory
Each anomaly is graded by thermal intensity and tied to the segment of distribution it affects, supporting prioritized maintenance, capital planning, and rate-case documentation.
Operations-Ready Documentation
Reports formatted for city engineering, distribution operations, and regulatory or rate-base reporting cycles. The data supports both day-to-day dispatch and long-cycle capital planning.

Built for the Cities With the Most Infrastructure to Inspect

Municipal Energy Utilities
City-owned and investor-owned utilities operating downtown steam, hot water, or chilled-water loops. One mission inventories the entire system without disruption.
City Engineering Departments
Public works and engineering teams responsible for underground infrastructure across agencies. Aerial coverage supports cross-system planning and capital coordination.
District Energy Operators
Downtown district energy systems serving commercial and institutional load. One survey produces a network-wide loss inventory to prioritize investment.
Steam Loop Operators
Cities operating legacy downtown steam loops where the inspection target is too large, too occupied, and too sensitive for ground or short-range surveys.

Why Aerial Infrared Is the Right Tool for a City

For a single block or a known problem location, ground-based thermography and short-range platforms have their place. For citywide distribution networks, the math changes fast — coverage area, urban airspace, and survey conditions all favor aircraft.

A single aircraft mission can scan an entire downtown service area in one overnight flight, with FAA coordination handled in advance. Our thermal sensors operate in the spectral bands engineered for ground-surface temperature differentials at altitude — not the consumer-grade wavelengths typical of short-range UAS payloads. We fly when the diurnal heat load has decayed and contrast is sharpest.

The result isn’t just faster — it’s more consistent. Every segment is scanned in the same flight, under the same conditions, with the same sensor. That consistency is what makes the dataset defensible for operations, capital planning, and regulatory decisions.

How a CityScan Engagement Works

01
Initial Conversation
A scoping call to understand the city — distribution miles, system type, agencies involved, regulatory considerations, and the decision-makers across operations and engineering.
02
Net Meeting
A working session with city operations, engineering, and utility leadership where we walk through the methodology, deliverables, and how the survey integrates with your GIS.
03
Scheduled Flight
We schedule the mission for the optimal thermal window and handle FAA coordination over the urban airspace. Flight plans are delivered in advance with no required service interruption.
04
Citywide Loss Report
A defensible thermal report tied to your utility GIS, ranking every anomaly across the network, with recommended next actions for repair, replacement, or further investigation.

The Cost of Operating a City System Without a Map

Downtown steam, hot water, and chilled-water loops are some of the most expensive utilities a city produces. Distribution losses of fifteen to twenty-five percent are common on aging networks, and a single uninspected segment can hide millions of dollars of annual loss. The ratepayer, the regulator, and the city’s capital planning office all eventually pay for what the utility doesn’t know.

CityScan IR converts that hidden loss into a citywide inventory your operations team can act on. Instead of chasing complaints or responding to surface symptoms, the system is managed against a ranked map of where the losses actually are. Most municipal operators recover the cost of the survey through fuel savings within a single operating year, and the data strengthens every subsequent capital case and rate proceeding the utility brings.

There is also a political and reputational return that matters on city systems. Underground utility failures in occupied downtown districts attract media coverage, council inquiry, and ratepayer scrutiny. A documented aerial survey demonstrates that the utility is operating its system with the best available tools, and the existence of the survey often shifts the narrative from reactive crisis management to proactive asset stewardship. Over time, that narrative compounds: utilities that survey on a defensible cadence build a track record their regulator, ratepayer commission, and city council can defend, and that track record is what protects rate cases, capital requests, and long-term operational autonomy.

Municipal operators who run CityScan on a defensible cadence operate a measurably more efficient distribution system than operators who don’t, and they do so with materially stronger documentation in front of every stakeholder that matters. The survey is an investment in operational efficiency, capital posture, regulatory standing, and political defensibility — all four of which compound over the operational life of the system.

Frequently Asked Questions

The mission captures ground-surface thermal data across the entire city service area, allowing us to identify losses from buried steam, hot water, and other distribution networks. The output is a citywide thermal dataset with every active anomaly classified and georeferenced against your utility GIS and as-built drawings. Every operational, capital, regulatory, and political decision the system supports becomes incrementally more defensible when it's grounded in a current, citywide thermal dataset rather than in a complaint log or a series of partial inspections. The longitudinal record is what protects the utility through every rate case and ratepayer conversation.
Coverage, consistency, and airspace. Aircraft scan an entire city in a single mission under the same atmospheric conditions, with FAA coordination handled for urban airspace. Short-range platforms are well matched to a single block or a known location, but a citywide survey by drone or ground walking introduces operational constraints and dataset inconsistency that aircraft simply don't have. The citywide capture is what differentiates the methodology — every block, alignment, and vault is documented against the same conditions, in the same record, on the same flight. That structural advantage is what lets the utility operate from a single defensible dataset rather than from a series of partial inspections.
No. The aircraft operates at altitude and the mission is flown overnight. No lane closures, no service interruption, and no ground coordination required. Downtown operations and traffic continue as normal throughout the survey, which is one of the larger operational advantages over ground or drone-based methods at city scale. The accuracy of the methodology has been demonstrated across decades of municipal energy work, and the deliverable format has evolved to integrate cleanly with the operational, capital, and regulatory workflows that modern city utilities run.
A typical downtown service area is scanned in a single overnight mission. Larger municipal networks are scheduled across one or two flight windows depending on the size of the service area and regional weather. Initial ranked findings are delivered within two to four weeks of the survey.
Findings are delivered as georeferenced features that import directly into your existing GIS, with metadata fields supporting dispatch, capital planning, and rate-base or regulatory reporting. The format is designed for municipal utility workflows rather than requiring the utility to maintain a parallel data system.
Most municipal operators benefit from a survey cadence of every two to four years, with more frequent inspection on networks approaching end of service life. Cities undertaking major capital projects often baseline the network before construction and re-survey after commissioning to document the as-built thermal condition.

Ready to Map Your City?

Tell us about the system. We’ll set up a working session with the right people across operations, engineering, and utility leadership and walk through how CityScan IR would apply to your network.