Utility-Scale Solar Inspection

Solar Field Infrared Surveys for Utility-Scale PV

Aircraft-based thermal inspection that maps module-level defects, string failures, and combiner-box anomalies across utility-scale solar fields in a single survey window.

37+ Years

Of Infrared Expertise

50 States

Plus Alaska & Puerto Rico

Aircraft

Not Drones

Engineered

For Facility Decision-Makers

What Is Aerial Solar Field Infrared Inspection?

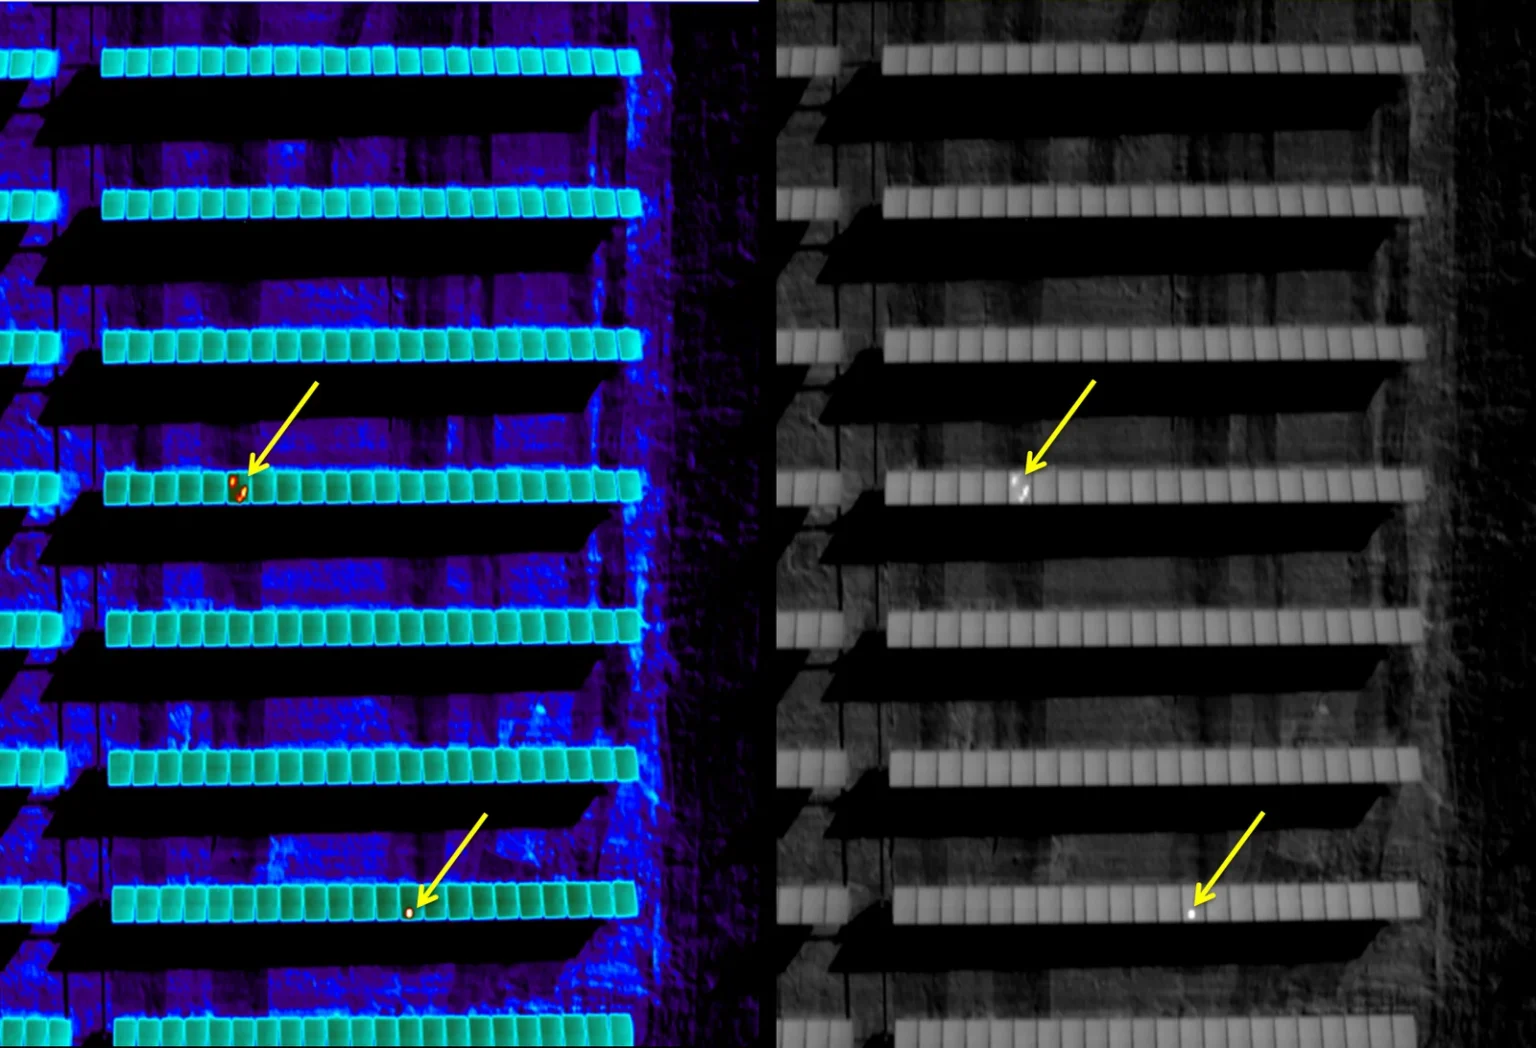
Aerial solar field infrared surveying is a non-destructive inspection method that uses aircraft-mounted thermal imaging to identify module-level defects, hot-spot strings, failed bypass diodes, and combiner-box anomalies across utility-scale photovoltaic arrays. Each thermal anomaly is captured at module-level resolution and georeferenced to its exact location on the site.

The result is a ranked defect inventory across the entire array — or across an entire portfolio — tied to your array layout drawings. Instead of dispatching against inverter telemetry alone, your O&M, asset, and engineering teams know which strings need attention, which modules need replacement, and where the array is operating as designed.

We’ve been doing this work for decades using aircraft engineered specifically for thermal collection — not consumer hardware, not adapted equipment. The data is built to support O&M dispatch, asset reporting, and module-warranty documentation.

What a Solar Infrared Survey Delivers

Module-Level Defect Mapping
Every thermal anomaly across the array — single-cell hot spots, failed bypass diodes, hot-spot strings, junction-box faults — captured at module-level resolution and georeferenced.
String & Combiner Diagnostics
Underperforming strings and combiner anomalies that don’t surface in inverter telemetry. Thermal evidence supports targeted troubleshooting rather than blind string-level investigation.
Defensible O&M Deliverables
Defect inventories formatted for O&M dispatch, asset reporting, and warranty-claim documentation. The report integrates with your CMMS and warranty submission workflow.

Built for Operators of Utility-Scale Solar

Independent Power Producers
Portfolio-level operators tracking generation across multiple utility-scale sites. Consistent inspection across the fleet supports standardized performance reporting.
Asset Managers & Owners
Owners and asset managers protecting financial performance against module degradation, string failure, and BOS issues. Thermal evidence supports warranty claims.
O&M Service Providers
Service providers responsible for fault response across one or many sites. Aerial inspection gives the team a ranked defect inventory to dispatch against.
Utilities & Co-Ops
Utility-owned and cooperative solar assets serving load directly. Aerial coverage supports rate-base reporting and capital decisions on aging arrays.

Why Aircraft-Based Infrared Outperforms Other Solar Inspection Methods

For a small or mid-scale array, ground-based thermography and short-range platforms have their place. For utility-scale sites and multi-site portfolios, the math changes fast — coverage area, irradiance window, and survey conditions all favor aircraft.

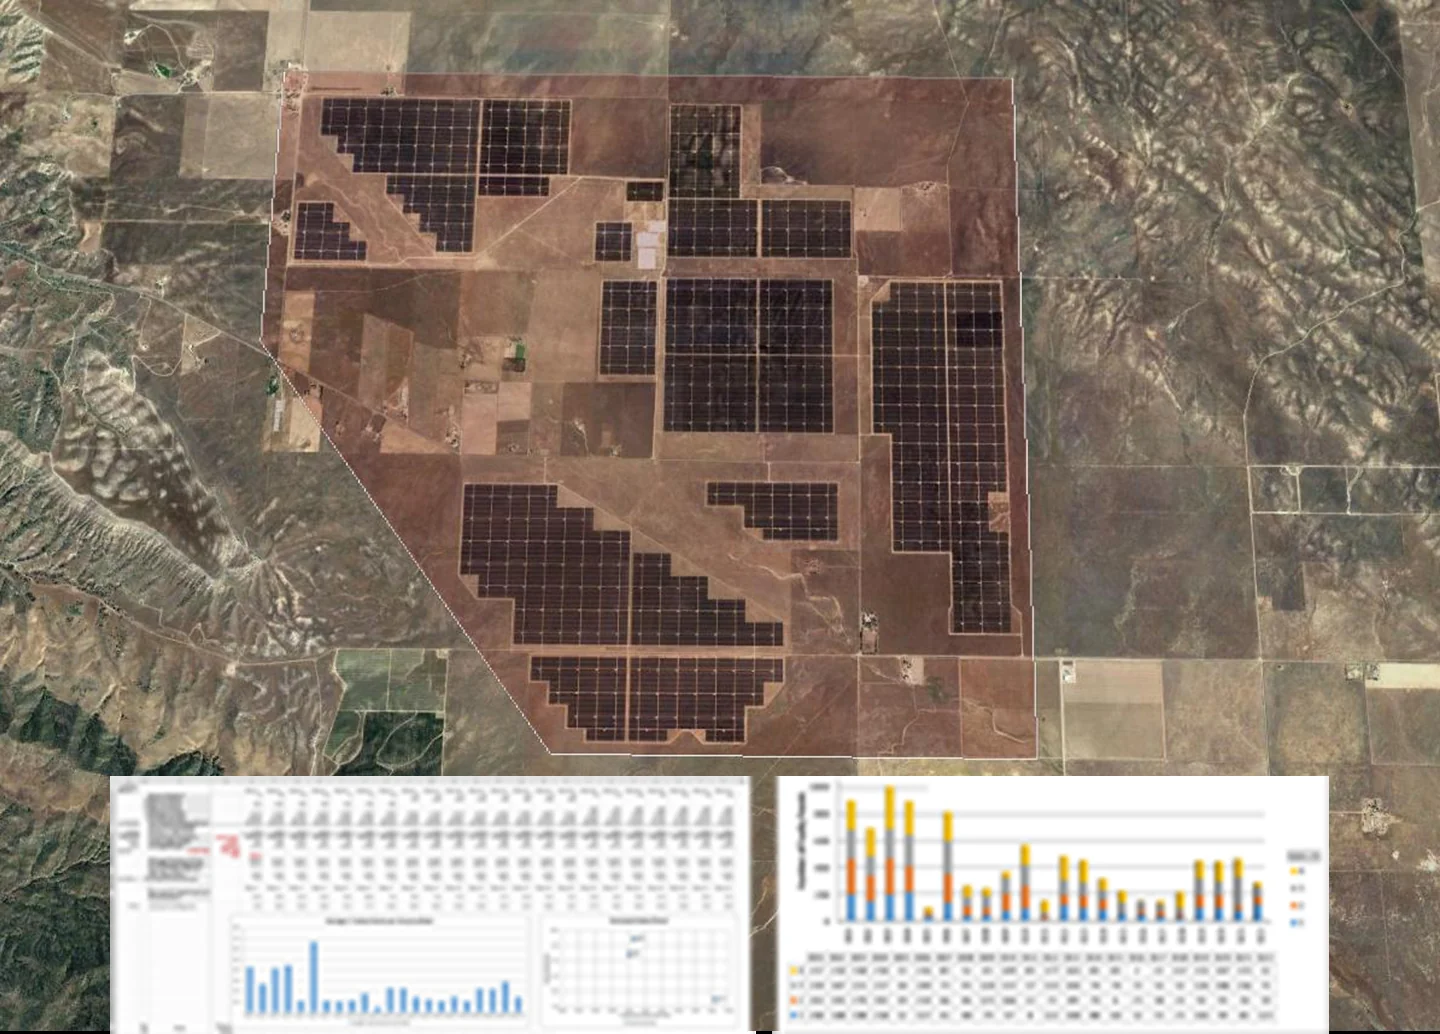
A single aircraft mission can scan the entire footprint of a utility-scale solar field in one irradiance window, or cover multiple sites in a geographic cluster in a single day. Our thermal sensors operate in the spectral bands engineered for module-level temperature differentials at altitude — not the consumer-grade wavelengths typical of short-range UAS payloads. We fly when irradiance and atmosphere support sharpest contrast.

The result isn’t just faster — it’s more consistent. Every module is inspected in the same flight, under the same irradiance, with the same sensor. That consistency is what makes the dataset defensible for O&M, warranty, and asset decisions.

How a Solar Survey Engagement Works

01
Initial Conversation
A scoping call to understand the asset — installed capacity, module technology, array layout, known performance issues, and the decision-makers on the operations and asset side.
02
Net Meeting
A working session with your O&M, asset, and engineering team where we walk through the methodology, deliverables, and how the survey integrates with your CMMS.
03
Scheduled Flight
We schedule the survey for the optimal irradiance window across your site or portfolio. Flight plans and any required site coordination are delivered in advance.
04
Defect Inventory Report
A ranked defect inventory tied to your array layout drawings, with thermal imagery for every anomaly, classification, and recommended O&M actions for dispatch.

The Cost of Letting a Solar Field Drift

Solar assets are revenue-producing equipment, and every undetected defect is generation lost forever. A single string-level fault on a utility-scale array can compound into thousands of kilowatt-hours of monthly loss before it surfaces at the inverter. A soiled or shaded section behaves the same way. A failed combiner is worse — it can take an entire array section offline without tripping a clear telemetry alarm.

Aerial infrared changes the economics. Instead of waiting for underperformance to surface in monthly generation reports, your team operates from a defect inventory that prioritizes the highest-impact issues across the site or fleet. For most operators, the cost of the survey is recovered in restored generation within a single quarter, and the prevented end-of-warranty losses compound the return across the asset life.

Warranty economics deserve their own emphasis. Module and inverter warranties are structured around documented defect rates within specific time windows. Operators who lack thermal evidence at the end-of-warranty inflection point are often forced to absorb losses that would have been recoverable with documentation. An aerial survey captured ahead of warranty expiration converts a subjective claim into a defensible submission backed by georeferenced thermal imagery — and for portfolios at the warranty inflection, the value of that documentation alone typically pays for the entire inspection program multiple times over.

Operators who survey on a defensible cadence run a measurably more productive portfolio than operators who don’t. The gap shows up in restored generation, in recovered warranty value at the inflection point, in lower unplanned-downtime hours, and in stronger documentation for any third-party audit. The survey is an investment in the asset’s financial performance, not a cost line on the O&M budget.

Frequently Asked Questions

The survey identifies module-level thermal anomalies including single-cell hot spots, failed bypass diodes, cracked or delaminated cells, hot-spot strings, junction-box and combiner-box faults, and BOS-level issues that produce a detectable thermal signature. Each finding is classified and ranked by impact, with thermal imagery supporting the diagnosis. Every operational, financial, and warranty decision the asset supports becomes incrementally more defensible when it's grounded in a current, module-level thermal dataset rather than in inverter telemetry alone. The longitudinal record is what protects the asset through refinancing, resale, and warranty inflection events.
Coverage area and condition consistency. Aircraft scan an entire utility-scale site, or an entire portfolio, in a single mission under the same irradiance and atmospheric conditions. Drones are well matched to small or mid-scale sites; above the utility-scale threshold, multiple sorties across multiple days produce a dataset that's harder to compare against itself. Aircraft deliver one dataset of one asset. The portfolio-wide capture is what differentiates the methodology — every module, string, and combiner is documented against the same conditions, in the same record, on the same flight. That structural advantage is what lets the operator manage a fleet from a single defensible dataset rather than from a season of partial inspections.
Under proper irradiance conditions and with experienced thermographic analysis, aerial infrared reliably identifies thermal anomalies at module level across utility-scale arrays. Defect classification is supported by representative ground verification and integrated with site telemetry where available. The workflow is the standard for utility-scale inspection. The accuracy of the methodology has been demonstrated across thousands of utility-scale arrays inspected over the operational life of the discipline, and the deliverable format has evolved to integrate cleanly with the asset-management and warranty workflows operators actually run.
A typical utility-scale site is scanned in a single irradiance window. Multi-site portfolios are scheduled across one or several flight days depending on geography and weather. Initial defect inventories are delivered within two to four weeks of the survey, with the full report and CMMS-ready data shortly after.
Thermal contrast is sharpest under peak irradiance with stable atmospheric conditions and no recent rainfall. Most of the continental U.S. supports several solid survey windows per year; scheduling depends on regional weather and the production cycle of the asset. We work with the operator to identify the window that supports the cleanest dataset.
Yes. Defect findings are documented with thermal imagery, georeferenced location, classification, and supporting metadata formatted for module-warranty submission and end-of-warranty assessments. The report is built to survive the manufacturer's review process and to provide a defensible record for any third-party asset audit.

Ready to Map Your Generation Losses?

Tell us about your asset. We’ll set up a working session with the right people on your team and walk through how an aerial survey would apply to your specific site or portfolio.