The U.S. Department of Energy has consistently documented distribution losses of fifteen to twenty-five percent on aging steam networks. For a central plant producing 100,000 pounds of steam per hour, the higher end of that range is twenty thousand pounds an hour disappearing into the soil — fuel burned for no productive purpose, year after year, until somebody finds it.
For universities, military installations, hospital campuses, and municipal energy operators running large distribution networks, finding it is the operational challenge. The losses aren’t visible from the surface. They aren’t reflected reliably in plant telemetry. They don’t show up consistently in complaints — most failures are detected when something visible happens at street level, and by then the line has been losing energy for months or years.
This post is about what aerial infrared captures on those networks, why ground-based inspection doesn’t scale to the problem, and what the deliverable looks like for the facilities and engineering teams that have to act on it.
What gets lost — and where
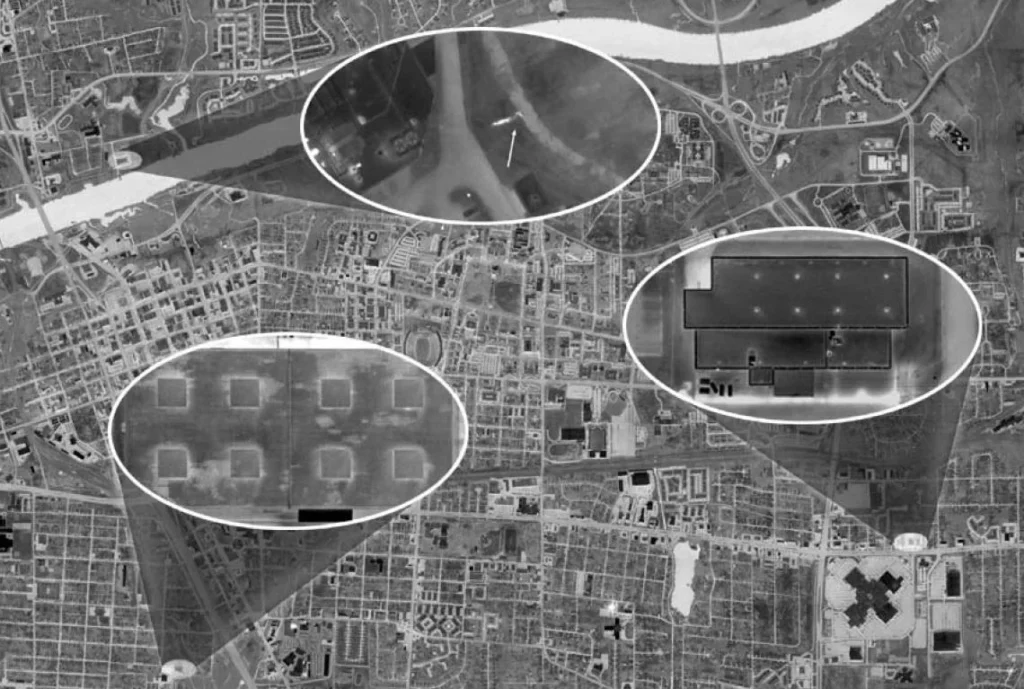
Steam distribution losses come from a handful of failure modes. The thermal signature changes based on the failure, and an aerial survey captures them all under the same window.
Failed expansion joints. Steam mains expand and contract through every operating cycle. Expansion joints are the most stressed components in the network — they tend to fail at the gland packing or the bellows, releasing steam into the conduit and then into the soil column above it. A failed joint produces a strong, localized thermal signature visible from altitude.
Pinhole and pipe failures. Aging steam pipes corrode internally and externally. Pinholes develop along welds, at low points where condensate sits, and at sections where the conduit has been compromised. The leak rate at any single pinhole is often low — a few pounds per hour — but compounded across dozens of pinholes on an aging network, the cumulative loss is significant.
Saturated insulation. When water enters a conduit (groundwater, condensate, surface infiltration), it saturates the insulation around the steam line. The line then loses heat continuously across the saturated section. The thermal signature is broader and less intense than a discrete leak, but covers more linear feet and represents significant loss.
Manhole and vault losses. Manholes and vaults are inspection points, but they’re also weak points. Steam leaks at the manhole interfaces — at the riser entries, at gland joints, at bottom drains — show up clearly in aerial imagery. These often go undocumented for years because the manhole itself is rarely opened.
For most large networks, the loss inventory we deliver includes representatives of all four failure modes. Our steam leak detection report ranks them by thermal intensity so the maintenance team can triage repairs against budget cycles and operational impact.
Why ground-based inspection doesn’t scale
Walking the network is the conventional approach. A technician with a handheld thermal camera or a leak-detection meter walks the alignment, identifying losses one segment at a time.
For a 200-foot service drop, this works fine. For a multi-mile campus distribution system, the approach breaks down for three reasons:
Conditions shift across the inspection. A walk of a 20-mile network takes weeks. The thermal conditions at week one are not the conditions at week four. Findings collected at the start of the inspection aren’t directly comparable to findings collected at the end. The ranking that informs the maintenance triage is built on an inconsistent baseline.
Instrument and observer calibration shifts. Handheld instruments drift. Observer interpretation varies across operators and across sessions. The findings have inherent inconsistency that’s hard to defend in front of an engineering or capital review.
Labor cost compounds. Multi-week labor, access coordination, safety procedures, and reporting overhead at the end of the inspection are rarely cheaper than a single-mission aerial survey covering the same footprint.
A drone-based survey shares the first two issues — multiple sorties, different battery cycles, different atmospheric conditions, different operators — at a smaller scale but the same structural problem. For a city-scale district energy network, or a university distribution system, the math favors aircraft.
What the aerial report contains
A typical aerial steam distribution report includes:
- A network-wide site map tied to the operator’s distribution drawings
- Every active loss georeferenced to its exact location on the network
- Thermal imagery for every documented anomaly
- Severity ranking by thermal intensity
- Failure-mode classification where the imagery supports it
- Recommended next actions for repair, replacement, or further investigation
The deliverable is built to integrate with the workflows facilities and engineering teams already run — engineering specifications, capital planning packages, regulatory or rate-base reporting. For municipal district energy operators, it also supports rate-case documentation. For district energy networks that have converted from steam to high-temperature hot water, the same methodology applies with adjusted thermal parameters under our HTHW leak detection service.
Cadence
How often to survey depends on network age, recent capital activity, and known problem segments.
A defensible cadence for most operators is every two to four years. Aging networks approaching end of service life benefit from more frequent inspection. Operators who have just completed a major capital replacement often baseline immediately after commissioning so the next survey has a clean comparison point.
K-12 districts and universities typically align inspection cadence to bond cycles or capital plan windows. Our SchoolSystemScanIR engagements are routinely scoped around bond proposal timelines so the thermal evidence supports the case the district makes to its board and voters.
Next step
If your team operates a steam distribution network and is evaluating inspection options, schedule a net meeting — we’ll walk through how an aerial survey would apply to your specific network footprint.